Science - How can I present data?
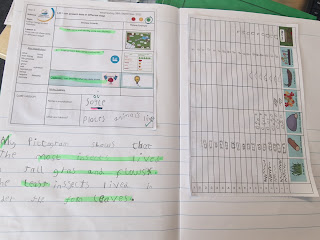
Today we looked at our data (information) and ways in which we can 'present' it. We learned how to draw a pictogram, presenting our data as images or symbols in columns. The children were incredible, and wrote some beautiful independent sentences on which microhabitats contained the most, and least insects.


Comments
Post a Comment